As many may know, Lync Server 2013 no longer requires separate servers for the Monitoring and Archiving role as they are now collocated directly on the front-end server. This is definitely a welcome changed as it reduces the amount of servers required for a Lync deployment. Not that the deployment process is overly complicated but the following serves to demonstrate the deployment process.
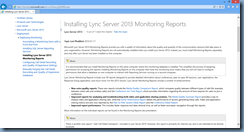
Before I begin, note that the official planning documentation Monitoring can be found here:
Components and Topologies for Monitoring
http://technet.microsoft.com/en-us/library/gg412952.aspx
Note that Microsoft recommends against collocated the monitoring database on the same SQL backend server of your front end server but for the demonstration purposes, we’ll be doing so:
The official planning documentation Archiving can be found here:
Components and Topologies for Archiving
http://technet.microsoft.com/en-us/library/jj204916.aspx
Associate Archiving and Monitoring SQL Store
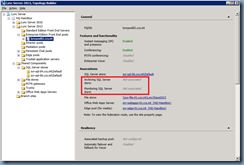
Begin by selecting the front end server that you’ll be enabling archiving and monitoring on as shown in the following screenshot which does not currently have an Archiving or Monitoring SQL store associated:
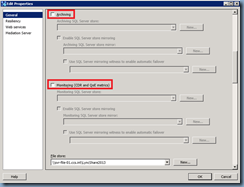
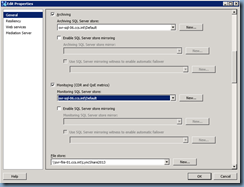
Proceed by right clicking on the front end pool, select properties and scroll down to the Archiving and Monitoring (CDR and QoE metrics) section:
Check the checkboxes for Archiving and Monitoring and if you haven’t created a SQL Server store for the databases, create one. In this example, I’ve selected the same back end SQL instance I used for the front end pool:
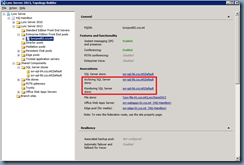
Click on the OK button after configuring the options and you’ll notice the association in the properties display of the front end server:
Publish Topology to create Archiving and Monitoring SQL Databases
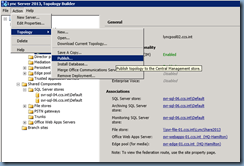
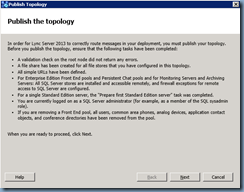
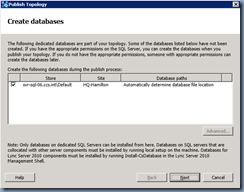
Proceed by publishing the topology:
Note that you have the option of specifically setting where to place the database files but for this example, I’ve left the settings as the default so the wizard will decide on the location:
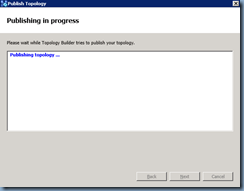
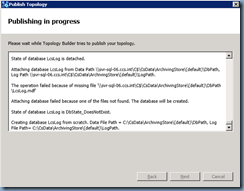
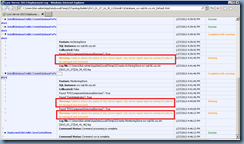
Note the output of the publishing process and how it creates the new database:
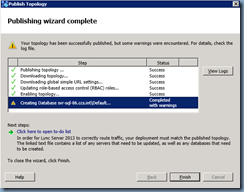
The publishing wizard actually does checks on your SQL server and the reason why I got a warning at the end was because, as the following logs state, the SQL server hosting the archiving and monitoring database does not have the SQL Server Agent started:
Warning: Failed to detect the status of SQL Server Agent. SQL Server Agent must be running for jobs to be managed and executed.
You can also verify where the database files were created by logging onto the database server. The server hosting my monitoring and archiving database only had 1 drive so the files were dropped directly into subfolders on it:
Monitoring Databases
C:\CsData\MonitoringStore\(default)\DbPath\LcsCDR.mdf
C:\CsData\MonitoringStore\(default)\DbPath\QoEMetrics.mdf
C:\CsData\MonitoringStore\(default)\LogPath\LcsCDR.ldf
C:\CsData\MonitoringStore\(default)\LogPath\QoEMetrics.ldf
Archiving Databases
C:\CsData\ArchivingStore\(default)\DbPath\LcsLog.mdf
C:\CsData\ArchivingStore\(default)\LogPath\Lcs.ldf
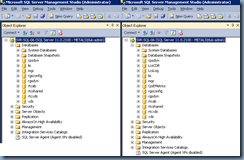
The 3 new databases can also be seen in the SQL Server Management Studio console:
- LcsCDR
- LcsLog
- QoEMetrics
Configure SQL Server Reporting Services
With the databases deployed, proceed with installing SQL Server Reporting Services if you haven’t already done so then configure the SSRS as shown in the following TechNet documentation:
http://technet.microsoft.com/en-us/library/jj204957.aspx
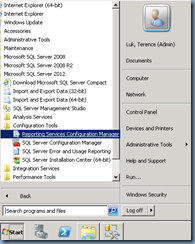
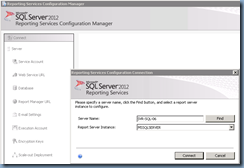
Launch Reporting Services Configuration Manager:
Connect to the SQL instance hosting SQL Server Reporting Services:
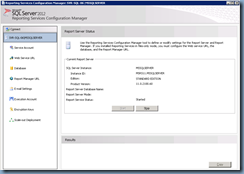
Ensure that the Report Server is started:
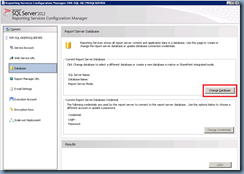
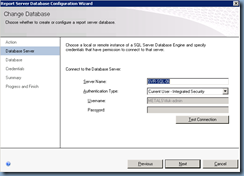
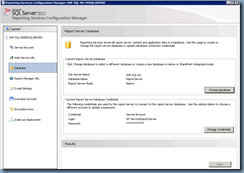
Configure the Report Server database by clicking on the Database node and selecting Change Database:
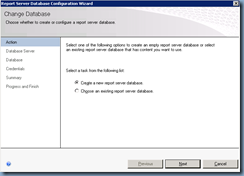
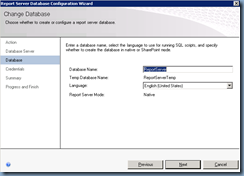
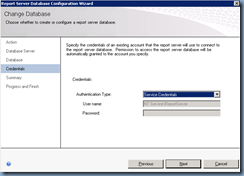
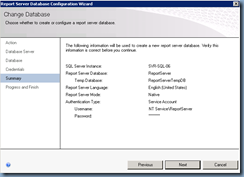
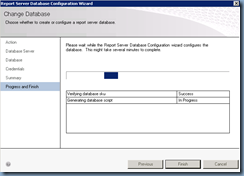
Create a new report server database:
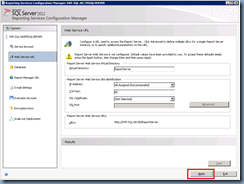
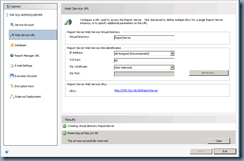
Create the Web Service URL but clicking on the Web Service URL node on the left,and if you’re satisfied with the defaults, scroll down and click on the Apply button to create the IIS directories:
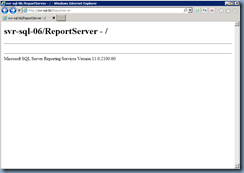
With the Web Service URL created, you can test connectivity by clicking on the link in the window:
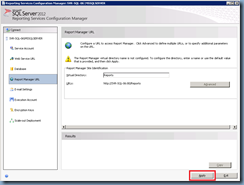
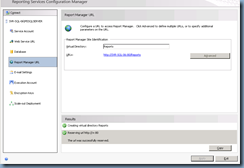
Continue with creating the Report Manager URL by clicking on the Report Manager URL node on the left and if you’re satisfied with the defaults, scroll down and click on the Apply button to create the IIS directories:
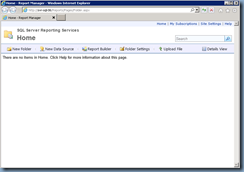
With the Report Manager URL created, you can test connectivity by clicking on the link in the window:
Deploy Monitoring Reports
http://technet.microsoft.com/en-us/library/jj204989.aspx
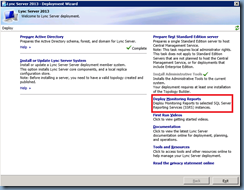
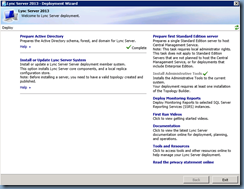
With the SQL Server Reporting Services configured, proceed by deploying the monitoring reports by launching the Deployment Wizard and clicking on Deploy Monitoring Reports:
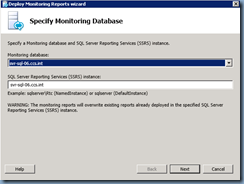
Select the server with monitoring database and the instance with SQL Server Reporting services:
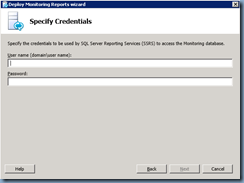
Specify an account that has permissions to SSRS:
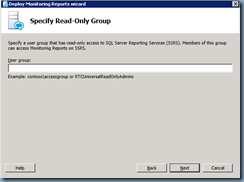
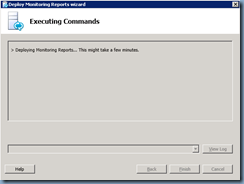
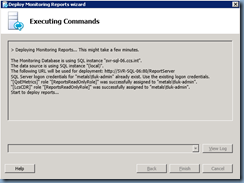
Specify a group that you would like to have access to the reports and continue through the wizard:
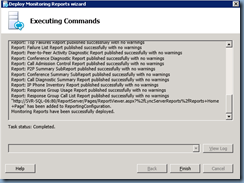
Verify that the Monitoring Reports are deployed
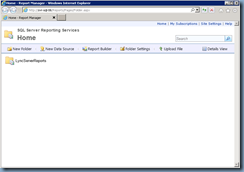
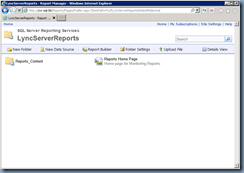
Once the reports have been successfully deployed, confirm that they are accessible through the SQL Server Reporting Services reports URL:
Note the familiar reports available:
Configure Monitoring and Archiving
With the databases and reports installed and configured, we can proceed with enabling them for the Lync Server 2013 environment:
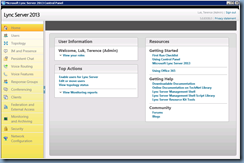
Launch the Lync Server 2013 Control Panel:
Navigate to the Monitoring and Archiving node:
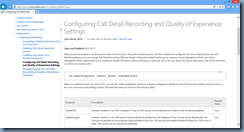
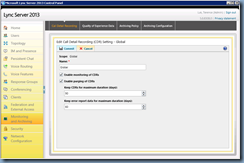
Configure the required settings for Call Detail Recording:
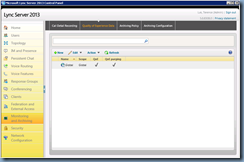
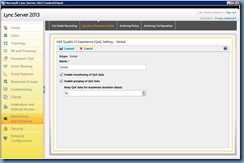
Quality of Experience Data:
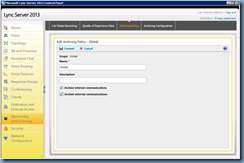
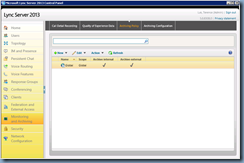
Archiving Policy:
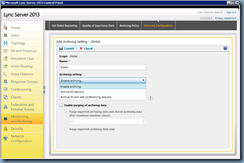
Archiving Configuration:
Ensure that you verify monitoring metrics are being captured by reviewing the SQL Server Reporting Services reports and exporting archived logs. For more information about exported archived IM messages, see one of my previous posts here:
Exporting Archived Logs from Lync Server 2013 Archiving Database
http://terenceluk.blogspot.com/2013/02/exporting-archived-logs-from-lync.html
